
📊 Full opportunity report: Q3 2026 SaaS Earnings Pre-Brief: The Litmus Test for the Agentic-Disruption Thesis on ThorstenMeyerAI.com — validation score, market gap, and execution plan.
TL;DR
The upcoming Q3 2026 SaaS earnings reports are set to serve as a critical test for the agentic-disruption thesis, with companies like ServiceNow and Salesforce showing signs of shifting toward consumption-based models. Market reactions and guidance will reveal whether this transition is accelerating or stalling.
The Q3 2026 SaaS earnings season will serve as a key indicator of whether the industry’s shift toward agentic, consumption-based models is accelerating or stalling, with major players like ServiceNow and Salesforce set to report. These results will test the broader thesis that SaaS economics are transitioning from per-seat licensing to AI-driven, consumption-based revenue streams, impacting valuations and strategic directions across the sector.
ServiceNow reported in April that over 50% of its net new business now derives from non-seat models, including tokens and infrastructure consumption, and raised its AI annual contract value (ACV) guidance from $1 billion to $1.5 billion, signaling a strong push toward consumption-based revenue. Despite beating top-line and profitability estimates, its stock fell 18% the following day, reflecting market skepticism about the durability of this transition.
Similarly, Salesforce’s Q4 FY26 report in late February highlighted a surge in Agentforce ARR to $800 million, up 169% YoY, and introduced the metric of Agentic Work Units (AWUs), which grew 57% quarter-over-quarter to 2.4 billion. The company also announced a restatement of its fiscal 2026 financials, segmenting its revenue into ‘Agentforce Apps’ and ‘Data 360, Platform & Other,’ emphasizing its strategic focus on agentic, AI-driven solutions. The market’s reaction has been mixed, with Salesforce’s stock experiencing volatility as investors interpret these signals.
Both companies’ guidance and segment disclosures suggest a broader industry trend toward consumption-based SaaS models, but it remains unclear whether this shift is accelerating or encountering resistance. The upcoming earnings reports will be the first comprehensive public data points to evaluate this transition at scale, with implications for valuations, competitive strategies, and enterprise adoption.
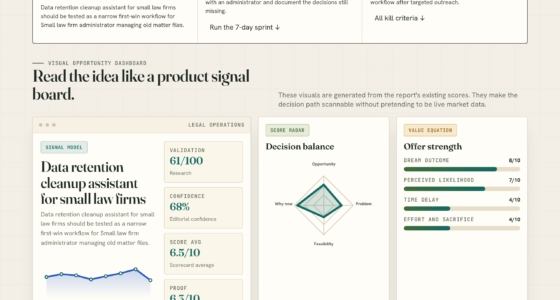
Six companies. Four metrics.
The litmus test for the agentic-disruption thesis at scale. July-August 2026.
Q1 baseline: ServiceNow beat earnings, raised AI ACV 50%, lost 18% in a day. Salesforce restated segments to separate Agentforce Apps from Data 360. Both stocks repriced lower despite beats. The Q3 cycle either confirms the consumption pivot is durable or accelerates the cohort selloff.
Four metrics. Four watch thresholds.
Investor focus has consolidated around four metrics that determine Q3 reactions. Each beats or misses produces asymmetric stock reactions: small misses produce large drops, small beats produce muted reactions.

The Product Analytics Compass: Building a Data-Informed Product Culture (The Product Leader Series)
As an affiliate, we earn on qualifying purchases.
As an affiliate, we earn on qualifying purchases.
Six companies. July-August 2026.
Six major SaaS companies report Q3 2026 calendar reports across July-August 2026. Each needs to prove specific elements of the four-metric scorecard.
July
name
August
name
August
exposed
July
exposed
July
exposure
August
exposure

Microsoft Fabric Handbook: Guide for Overview, Policy, Governance, AI Adoption and Solution Deployment Leveraging Microsoft Fabric
As an affiliate, we earn on qualifying purchases.
As an affiliate, we earn on qualifying purchases.
Three outcomes. One cohort.
25/50/25 probability allocation reflects genuine uncertainty in the data. Q1 was already mixed (beats produced selloffs); Q3 follows the same pattern unless metrics move decisively.
- Non-seat 50%+ sustainsNOW pivot durable.
- AWU >50% Q/QCRM Agentforce traction holds.
- $1M+ ACV >120% Y/YEnterprise concentration accretive.
- RDR >108%Switching costs real.
- Outcome: NOW recovers 18% drop. Multiple expands.
- Non-seat 50%NOW pivot equilibrium.
- AWU 35-45% Q/QCRM deceleration visible.
- $1M+ ACV 80-100%Saturation early signals.
- RDR 105-110%Durability uncertain.
- Outcome: Multiples compressed through Q4 next litmus test.
- Non-seat <45%NOW pivot stalled.
- AWU <30% Q/QCRM Agentforce deceleration confirmed.
- $1M+ ACV <80%Enterprise saturation visible.
- RDR <105%Consumption customers churning faster than seats.
- Outcome: 10-20% cohort compression. Recovery extends mid-2027.
SaaS as a category is in active structural transformation. Each quarterly cycle through 2026-2027 produces incremental data on whether the per-seat-to-consumption transition is durable or destructive. Q3 2026 is one data point in a longer arc.
consumption-based SaaS billing platform
As an affiliate, we earn on qualifying purchases.
As an affiliate, we earn on qualifying purchases.
Four assignments. By role.
Update positioning ahead of Q3.
Long ServiceNow / Salesforce on non-seat-share + AWU-growth thesis if you believe consumption pivot is durable. Underweight if structurally worse than per-seat. Use four-metric scorecard to update each quarterly cycle through 2027. Asymmetric setup means small misses produce large reactions.
Time the Q3 cycle precisely.
If incumbents miss → accelerate customer-acquisition + fundraising. If incumbents beat → prioritize retention + unit economics over top-line. 25/50/25 probability suggests cautious-optimistic positioning is default. The customer-acquisition window opens or closes based on Q3 prints.
Negotiate multi-year protections.
AWU rate caps, renewal-term commitments, exit provisions. Incumbents that commit are pricing for durable equilibrium; incumbents that resist are extracting transitional premium. Q3 reveals which is which. Time multi-year commitments to incumbent transparency on consumption pricing.
Engage on structured-financing.
Anthropic-Blackstone JV template applies to SaaS facing same scaling challenge. Engagements through July-September; SaaS companies missing on four metrics become more receptive. Window for advantaged structuring is open through Q4 2026; thereafter pricing advantage compresses as template replicates.

FINANCIAL REPORTING+…-CONNECT ACCESS
As an affiliate, we earn on qualifying purchases.
As an affiliate, we earn on qualifying purchases.
Implications of Q3 SaaS Earnings for Industry Transition
The upcoming Q3 2026 SaaS earnings season is critical because it will confirm whether the industry’s shift toward agentic, consumption-based models is accelerating. If companies like ServiceNow and Salesforce demonstrate sustained growth in non-seat revenue and AI-driven metrics like AWUs, it would validate the thesis that SaaS economics are fundamentally changing. This shift could lead to revaluation of SaaS stocks, influence enterprise purchasing strategies, and prompt new strategic responses from SaaS providers, including potential joint ventures with AI-focused firms.
Conversely, if the transition stalls or if guidance indicates margin compression or declining consumption growth, it could slow or reverse the perceived shift, impacting valuations and strategic planning. The results will also influence whether new industry standards around segment transparency and performance metrics emerge, shaping investor expectations and competitive dynamics.
Recent Developments Supporting the Transition to Agentic SaaS
In April-May 2026, ServiceNow surpassed 50% of net new business from non-seat models, raising its AI ACV guidance by 50%. Salesforce’s Q4 FY26 report revealed a 169% YoY increase in Agentforce ARR and introduced the AWU metric, emphasizing a focus on AI-driven task completion. Both companies’ disclosures reflect a broader industry trend: SaaS providers are increasingly relying on consumption-based models and AI-enabled solutions, moving away from traditional per-seat licensing.
These developments are part of a larger structural shift, driven by the rise of frontier labs, Chinese low-cost APIs, and AI deployment strategies that favor infrastructure consumption over licensing. The April-May earnings cycle set the stage for the upcoming Q3 reports to confirm whether this transition is gaining momentum or facing headwinds.
“Fifty percent of our net new business now comes from non-seat models—tokens, infrastructure, connector usage—and half of our revenue is consumption-based.”
— Bill McDermott, ServiceNow CEO
Uncertainties Surrounding the Q3 Earnings Impact
It remains unclear whether the strong growth signals from ServiceNow and Salesforce will persist through Q3, or if market skepticism and margin pressures will lead to a slowdown. The actual guidance issued by these companies and other SaaS firms will be critical in confirming whether the industry’s transition is accelerating or encountering resistance. Additionally, the extent to which new strategic responses, such as joint ventures with AI-focused firms, will materialize remains uncertain.
Next Steps for Industry Validation and Strategic Pivoting
Following the Q3 earnings reports, investors and industry analysts will closely examine revenue segmentation, guidance on consumption margins, and the growth of AI-driven metrics like AWUs. Companies may also announce new joint ventures or strategic partnerships aimed at scaling agentic deployment. The results will determine whether the market re-rates SaaS valuations downward, reflecting a transition to consumption models, or upward, if the shift proves durable and sustainable.
Further, industry standards around segment transparency and performance benchmarks are likely to evolve based on these disclosures, shaping future investor expectations and competitive strategies.
Key Questions
What is the agentic-disruption thesis in SaaS?
The agentic-disruption thesis suggests that SaaS providers are shifting from traditional per-seat licensing to AI-enabled, consumption-based revenue models, fundamentally transforming SaaS economics and valuation metrics.
Why are ServiceNow and Salesforce significant in this transition?
Both companies are leading indicators: ServiceNow has over 50% of net new business from non-seat models, and Salesforce has introduced the Agentforce metric and segmented its revenue, signaling a strategic shift toward agentic, AI-driven SaaS solutions.
What will the Q3 2026 earnings reveal about this shift?
The reports will show whether growth in consumption-based revenue and AI metrics is sustained or slowing, providing evidence for or against the ongoing industry transition.
Could this shift impact SaaS valuations?
Yes, if consumption models prove durable and scalable, SaaS valuations may re-rate higher; if the transition stalls or margins compress, valuations could decline.
Are there risks of strategic countermeasures from SaaS providers?
Yes, some companies might respond with joint ventures or new product strategies to defend traditional licensing revenue, which could influence market dynamics and the pace of industry change.
Source: ThorstenMeyerAI.com