
📊 Full opportunity report: AI-Enhanced Warzone Visuals: A Peek Into The Future on ThorstenMeyerAI.com — validation score, market gap, and execution plan.

Get business pricing on monitors, keyboards and dev gear
- Business-only prices and quantity discounts
- Tax-exempt purchasing
- Multiple users, one account, clear invoices
TL;DR
A new web-based visualization transforms real-time Bitcoin trading data into a cinematic battlefield, offering an immersive, artistic view of market dynamics. It uses advanced browser tech and is accessible for free.
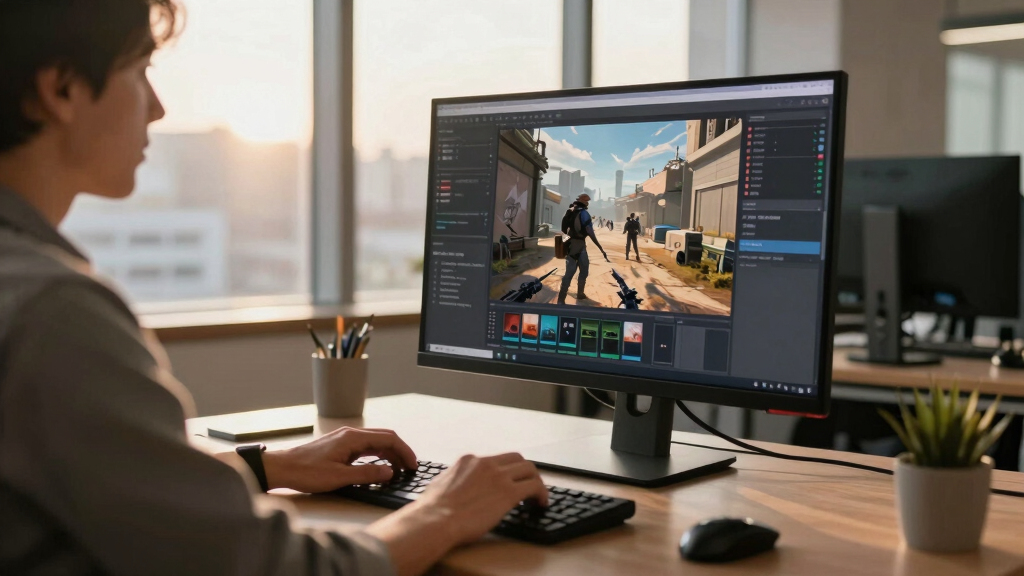
A new web-based visualization project transforms real-time Bitcoin trading data into a cinematic battlefield, providing an immersive artistic experience that depicts market activity as a war scene. Developed using cutting-edge browser technology, this tool offers viewers a visceral, data-driven view of market dynamics without involving trading or financial advice. The project, accessible instantly via any modern browser, highlights the potential of AI-enhanced visuals in financial data representation.
The visualization, called Bitcoin War, connects directly to public Binance and Coinbase trade streams via WebSocket, ensuring continuous real-time data flow. It depicts buy and sell orders as opposing armies, with large liquidations visualized as airstrikes, creating a visceral battlefield scene. The system utilizes Canvas 2D graphics, WebAudio synthesis, and minimal client-side code—roughly 180KB—to deliver a dynamic visual and auditory experience without backend infrastructure.
Features include an automatic camera system shifting perspectives between broad views and detailed skirmishes, a live DEFCON meter indicating market volatility, and a scrolling log narrating ongoing trades. A synthetic soundtrack generated within the browser heightens the tension, while a comprehensive scoreboard tracks market gains, casualties, and territorial control in dollars. Importantly, the project emphasizes that it is not a trading tool—no wallets, signals, or advice are involved—and explicitly states, ‘a live reading of the BTC/USDT tape · no advice, only war.’
Implications of Cinematic Visualization for Market Perception
This project demonstrates how advanced web technologies can be harnessed for artistic and educational purposes, providing a new lens through which to understand market volatility and activity. By visualizing trading data as a war scene, it offers a visceral, engaging way to observe the chaos and dynamics of cryptocurrency markets, potentially influencing how traders, enthusiasts, and the public perceive financial activity. It also showcases the growing role of AI and browser-based graphics in creating immersive data experiences.
web-based financial data visualization software
As an affiliate, we earn on qualifying purchases.
As an affiliate, we earn on qualifying purchases.
Emergence of Artistic Data Visualizations in Financial Markets
Recent developments have seen increasing use of interactive and artistic visualizations to represent complex market data, driven by advances in browser technology and WebGL. Projects like Bitcoin War build on this trend by transforming raw trading streams into cinematic narratives, emphasizing the chaotic and competitive nature of markets. While traditional charts remain dominant, such immersive visualizations are gaining attention for their ability to engage broader audiences and provide alternative insights into market volatility.
“This visualization pushes the boundaries of how we interpret market data, blending art and technology to create an immersive experience.”
— an anonymous researcher
interactive cryptocurrency market display
As an affiliate, we earn on qualifying purchases.
As an affiliate, we earn on qualifying purchases.
Unconfirmed Aspects and Future Developments
It is not yet clear whether similar visualizations will be adopted for mainstream trading platforms or if this remains a purely artistic project. The long-term impact on market analysis or trading behavior is also unknown. Additionally, details about the underlying AI algorithms or data processing techniques used for visual effects have not been fully disclosed, leaving some technical aspects unconfirmed.
real-time Bitcoin trading visualization
As an affiliate, we earn on qualifying purchases.
As an affiliate, we earn on qualifying purchases.
Next Steps for Visualization and Market Engagement
Developers plan to enhance the visualization with more detailed analytics and possibly integrate user interaction features. Future updates may include more sophisticated AI-driven effects and expanded data sources. Observers will likely watch for adoption by other platforms or integration into educational tools, with ongoing evaluations of its influence on public perception of market volatility.
browser-based market analysis tool
As an affiliate, we earn on qualifying purchases.
As an affiliate, we earn on qualifying purchases.
Key Questions
Is this visualization a trading tool?
No, it is purely an artistic and educational visualization that reflects real-time market data without providing trading signals or advice.
How does the visualization work technically?
It connects directly to public Binance and Coinbase trade streams via WebSocket, using Canvas 2D graphics, WebAudio, and minimal client-side code to produce real-time visual and audio effects.
Can I access this visualization easily?
Yes, it is available for free and runs instantly in any modern web browser at war.isbitcoindead.com.
Will this influence actual trading decisions?
No, the project explicitly states it is not a trading tool and does not involve any financial advice or signals.
Source: ThorstenMeyerAI.com
Fall Picks
fall essentials
As an affiliate, we earn on qualifying purchases.