
📊 Full opportunity report: Bitcoin Battles Unfold in Live Warzone Visualization on ThorstenMeyerAI.com — validation score, market gap, and execution plan.
TL;DR
A novel web-based tool visualizes Bitcoin trading activity as a live war scene, showing the ongoing tug-of-war between buyers and sellers. It connects directly to Binance and Coinbase streams, offering an immersive, artistic perspective on market volatility. This project highlights advanced browser tech for creative data visualization.
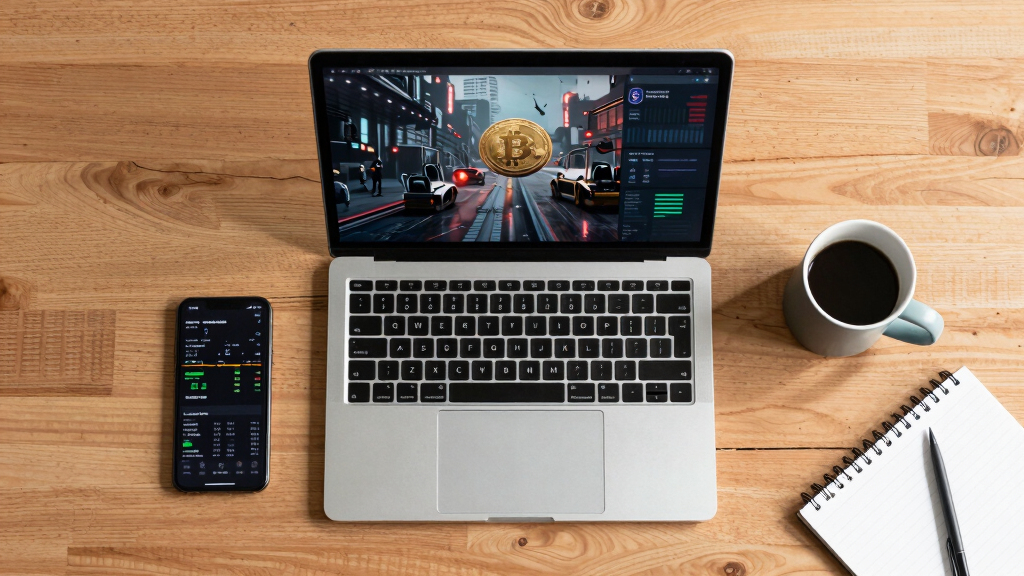
The Bitcoin War visualization has been launched, offering a live, cinematic depiction of Bitcoin trading activity. Developed by isbitcoindead.com, this tool transforms real-time BTC/USDT trades into a dynamic battlefield, illustrating the ongoing tug-of-war between buyers and sellers. The project is designed for tech enthusiasts and does not provide trading signals or advice, emphasizing its artistic and data-driven purpose.
The visualization connects directly to the public Binance trade stream via WebSocket, with a fallback to Coinbase, ensuring continuous data flow. Each market tick is represented as a combatant—buy orders from the Cobalt Host push the front line from the left, while sell orders from the Ember Legion push back from the right. Large liquidations are visualized as airstrikes, heightening the visceral effect. The entire system runs entirely client-side, utilizing Canvas 2D graphics, WebAudio synthesis, and real-time stream processing, with a minimal footprint of roughly 180KB.
The project features an automatic camera system that shifts perspectives between wide views and close-up skirmishes, along with a live DEFCON meter indicating market volatility. A scrolling war log narrates ongoing activity, and a synthetic soundtrack generated within the browser amplifies the tension. A comprehensive scoreboard tracks seconds won, casualties, and dollar-based territorial gains, creating a vivid, cinematic representation of market movements.
Importantly, the creators emphasize that Bitcoin War is not a trading tool; it does not involve wallets, signals, or investment advice. Its purpose is solely artistic and educational, offering a raw visualization of market chaos through a creative lens. The project is accessible for free and can be run instantly in any modern browser by visiting war.isbitcoindead.com.
Implications of Artistic Market Visualization
This project demonstrates how advanced web technologies can be harnessed to create immersive, artistic representations of financial data, providing a new way for enthusiasts and observers to interpret market activity. While not a trading tool, it offers a visceral understanding of volatility and order flow, potentially influencing how market dynamics are visualized and understood in a non-technical context. It also highlights the growing intersection of technology, art, and finance, emphasizing the importance of creative data presentation in the digital age.

Bitcoin Merch Gold Nugget Lottery Miner, WiFi-Enabled Bitcoin Solo Miner, 377 KH/s Hashrate, Ultra-Low Power Consumption, Compact Design
- Mining Type: Solo Bitcoin mining with WiFi
- Hashrate: 377 KH/s optimized performance
- Lottery Chance: Increased 680% lottery probability
As an affiliate, we earn on qualifying purchases.
As an affiliate, we earn on qualifying purchases.
Background on Market Visualizations and Web Tech
Traditional market visualizations focus on charts, order books, and technical indicators. The Bitcoin War project breaks from this norm by transforming real-time trades into a cinematic scene, leveraging modern browser capabilities such as WebSocket, Canvas, and WebAudio. Developed by isbitcoindead.com, it builds on recent trends in web-based data visualization and interactive art, showcasing how browser tech can create complex, engaging experiences without backend infrastructure. The project aligns with ongoing efforts to make market data more accessible and visually compelling.
“This visualization offers a visceral, artistic perspective on market chaos, making complex data more intuitive and engaging.”
— an anonymous researcher
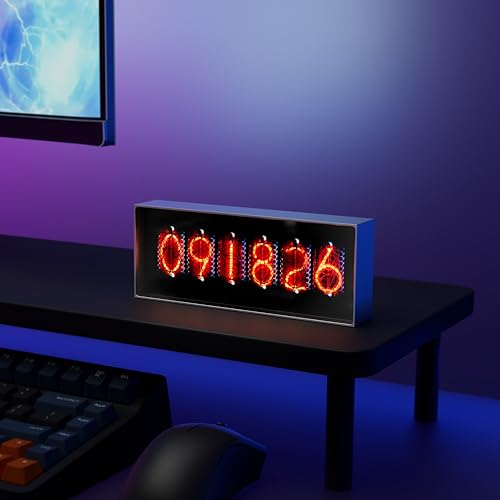
Electronic Display for Real-Time Cryptocurrency/Bitcoin/Stock Market Data, Time, Weather & Temperature, 164*28*65mm, Supports Image Upload and 30s Video Playback, App-Controlled, 960*360 Resolution
- Real-Time Data Display: Cryptocurrency, stock, time, weather updates
- Custom Media Uploads: Upload images and 30s videos
- App-Controlled Management: Manage content and display modes
As an affiliate, we earn on qualifying purchases.
As an affiliate, we earn on qualifying purchases.
Unconfirmed Aspects of Market Representation
It is not yet clear how accurately the visualization reflects real-time market conditions or whether it incorporates all trading nuances. The artistic interpretation may simplify or exaggerate certain dynamics, and its effectiveness as an analytical tool remains untested. Additionally, the extent to which it influences viewer perception of market activity is still unknown.

MAMAGO Inspirational Canvas Wall Art 3 Pieces Motivational Bitcoin Painting Modern Posters Prints Artwork Home Decoration for Living Room Bedroom Office Framed Ready to Hang – 12"x16"x3pcs
- Wall Art Size: 12×16 inches per panel
- High-Quality Printing: Waterproof and UV resistant canvas
- Ready to Hang: Includes hooks and gallery wrapped
As an affiliate, we earn on qualifying purchases.
As an affiliate, we earn on qualifying purchases.
Future Developments and Potential Enhancements
Developers plan to update the visualization with additional features, such as more detailed combat animations and expanded market data integration. There may also be efforts to incorporate user interaction or educational components to deepen understanding. Monitoring the project’s reception and potential integration into broader educational or analytical platforms will be key in the coming months.
Electronic Display for Real-Time Cryptocurrency/Bitcoin/Stock Market Data, Time, Weather & Temperature, 164*28*65mm, Supports Image Upload and 30s Video Playback, App-Controlled, 960*360 Resolution
- Real-Time Data Display: Cryptocurrency, stock, time, weather updates
- Custom Media Uploads: Upload images and 30s videos
- App-Controlled Management: Manage content and display modes
As an affiliate, we earn on qualifying purchases.
As an affiliate, we earn on qualifying purchases.
Key Questions
Is the Bitcoin War visualization a trading tool?
No, it is purely an artistic and data visualization project. It does not provide trading signals, advice, or involve wallets.
How does the visualization connect to market data?
It connects directly to the public Binance trade stream via WebSocket, with a fallback to Coinbase, ensuring real-time updates.
Can I access the visualization easily?
Yes, it is available for free and runs instantly in any modern browser at war.isbitcoindead.com.
What does the visualization aim to show?
It aims to depict the chaos and dynamics of Bitcoin trading as a cinematic battlefield, emphasizing market volatility and order flow visually.
Are there plans to expand this project?
Developers have indicated plans for future updates, including more detailed animations and possibly interactive features.
Source: ThorstenMeyerAI.com