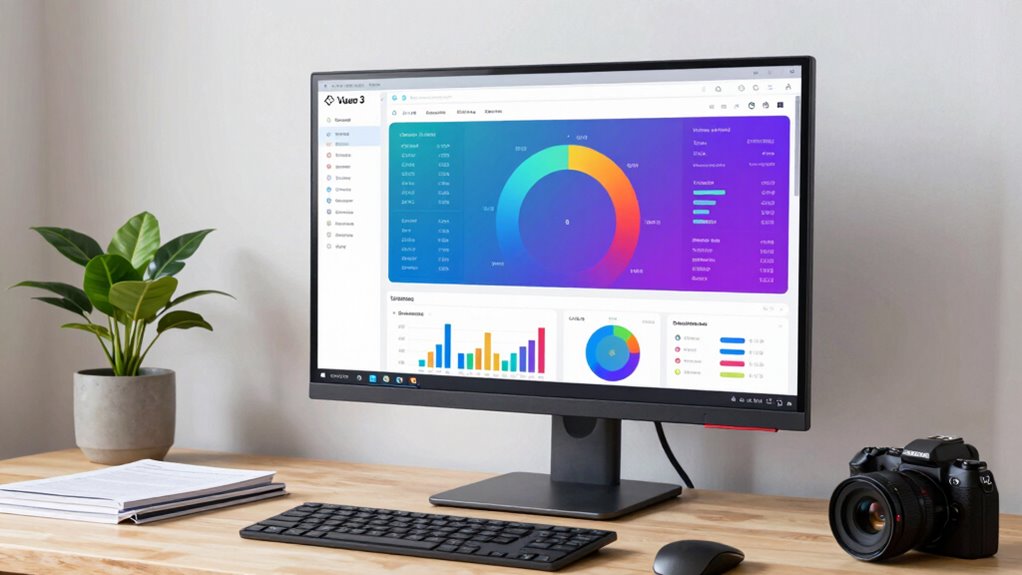

To create a Vue 3 dashboard with Pinia and Chart.js, start by setting up Vue 3 with the composition API for better component organization. Use Pinia to manage your app’s state, like filters and chart preferences, ensuring data stays synchronized. Integrate Chart.js components, passing data and options as props, so your charts automatically update when state changes. This approach offers a responsive, interactive experience—continue exploring to discover how each piece collaborates seamlessly.

Get business pricing on monitors, keyboards and dev gear
- Business-only prices and quantity discounts
- Tax-exempt purchasing
- Multiple users, one account, clear invoices
Key Takeaways
- Set up Vue 3 with Pinia for centralized state management and define reactive data properties.
- Integrate Chart.js by creating Vue components that accept data and configuration props.
- Use Pinia store to manage user preferences, filters, and chart configurations for consistency.
- Bind store data to Chart.js components to enable automatic reactive updates on state changes.
- Design a responsive, user-friendly dashboard with filters, data ranges, and chart type toggles.
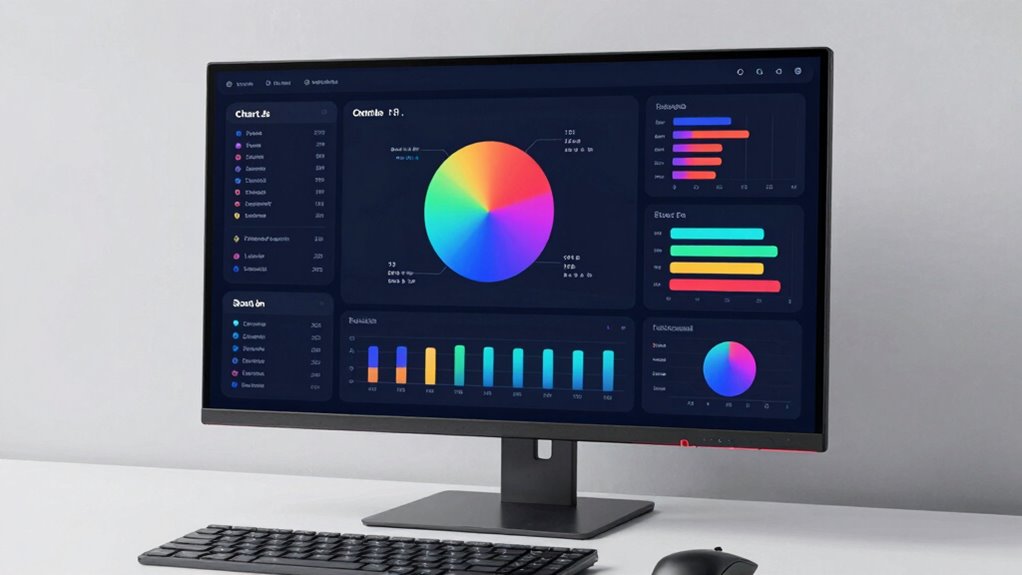
Building a Vue 3 dashboard with Pinia and Chart.js is a straightforward way to create dynamic, interactive data visualizations. When you design your dashboard, the user interface becomes the central element that determines how users interact with your data. A clean, intuitive interface helps users easily navigate through different data sets, filters, and visualizations, making complex information more accessible. Vue 3’s reactive system, combined with Pinia for state management, guarantees your data stays synchronized across components, providing a seamless experience. Chart.js then transforms this data into engaging, easy-to-understand charts that update in real time as your data changes.
To start, you need a solid structure for your user interface. Vue 3’s composition API makes it simple to organize your components, and you can leverage its reactive properties to handle user inputs, selections, and filters. With Pinia, you set up a centralized store that manages your application’s state, such as selected data ranges, chart types, or other preferences. This setup allows you to keep your UI responsive and consistent, as any change in the store automatically triggers updates across all related components. For example, when a user selects a different date range, the store updates, and your data visualization reflects this immediately.
Integrating Chart.js into your Vue 3 dashboard is straightforward. You can create a dedicated chart component that accepts props for the data and configuration options. When your store updates data, your chart component re-renders automatically, thanks to Vue’s reactivity system. This setup means your visualizations stay in sync with user interactions without extra effort. You can customize your charts with various options like colors, labels, and tooltips to match your dashboard’s style and improve clarity. Additionally, understanding the reactive system in Vue 3 helps optimize how your charts respond to data changes for smoother updates.
The key to creating an effective data visualization dashboard is to focus on clarity and usability. Use Chart.js to highlight important trends, patterns, and outliers in your data. Combine different chart types—bar, line, pie—to display various aspects of your data story. Your user interface should allow easy switching between these visualizations, filtering data, and drilling down into specifics. The combination of Vue 3, Pinia, and Chart.js offers the flexibility to build a dashboard that’s both powerful and user-friendly, enabling you to deliver insights effortlessly.
As an affiliate, we earn on qualifying purchases.
Frequently Asked Questions
How Do I Optimize Chart Rendering Performance in Vue 3?
To optimize chart rendering performance in Vue 3, you should implement data caching to prevent unnecessary data processing and re-renders. Use lazy loading for charts so they only load when visible, reducing initial load time. Also, consider debouncing resize events and limiting updates with Vue’s reactivity system. These strategies help keep your dashboard smooth and responsive, especially with large datasets or multiple charts.
Can I Integrate Third-Party Plugins With Chart.Js in This Setup?
Integrating third-party plugins with Chart.js in your setup is like fitting puzzle pieces together; it’s entirely possible. You can do this through plugin compatibility and plugin integration methods. Make certain the plugins are compatible with Chart.js version 3 or later, then import and register them within your Chart.js configuration. This approach allows you to extend functionality seamlessly, enriching your dashboard’s visual and interactive features without disrupting your Vue 3 and Pinia flow.
How to Handle Real-Time Data Updates in the Dashboard?
You can handle real-time data updates by integrating WebSocket into your Vue 3 dashboard. Set up a WebSocket connection to receive real-time data streams, then update your Pinia store with incoming data. This triggers reactive Chart.js components to re-render automatically, keeping your dashboard current. Make sure to manage WebSocket connections properly, closing them when not needed, to optimize performance and avoid memory leaks.
What Are Best Practices for State Management With Pinia?
Did you know that proper state management reduces bugs by 30%? With Pinia, you should focus on state synchronization to keep data consistent across components. Use mutation strategies like actions for complex updates, ensuring predictable state changes. Keep your state modular and organized, and leverage Pinia’s store structure for clarity. This approach makes your dashboard more maintainable, responsive, and easier to debug, leading to a smoother user experience.
How to Customize Chart Styles and Themes Effectively?
You can customize chart styles and themes by adjusting color schemes and font customization in Chart.js options. Choose a consistent color palette that matches your overall app theme and update the `colors` array in your chart configuration. For fonts, modify the `font` property within the `options` to set font family, size, and style. This guarantees your charts align with your branding, creating a cohesive and visually appealing dashboard.
As an affiliate, we earn on qualifying purchases.
Conclusion
By weaving Vue 3, Pinia, and Chart.js together, you’ve crafted a vibrant tapestry of data and design. Each tool acts as a thread, seamlessly stitching functionality with aesthetics. Just as a compass guides a sailor through uncharted waters, this dashboard becomes your navigator in data exploration. Remember, the true power lies in your hands—your vision transforms raw information into a guiding star, illuminating insights and steering your project toward success.
Chart.js data visualization tools
As an affiliate, we earn on qualifying purchases.
As an affiliate, we earn on qualifying purchases.
Vue 3 responsive chart components
As an affiliate, we earn on qualifying purchases.
As an affiliate, we earn on qualifying purchases.
Halloween Picks
halloween
As an affiliate, we earn on qualifying purchases.