
📊 Full opportunity report: The $725 Billion Question: Hyperscaler Capex Q1 2026 and What the Earnings Don’t Answer on ThorstenMeyerAI.com — validation score, market gap, and execution plan.
TL;DR
In Q1 2026, Microsoft, Amazon, Alphabet, and Meta revealed a record-breaking $725 billion in AI-related capital expenditure, marking the largest in tech history. Despite strong spending, market reactions suggest doubts about the efficiency and revenue impact of this investment.
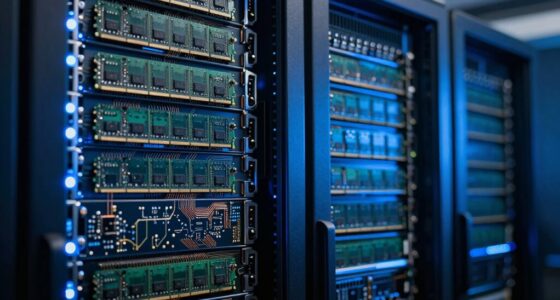
The four largest hyperscalers—Microsoft, Amazon, Alphabet, and Meta—reported a combined AI-related capital expenditure of approximately $725 billion for 2026, surpassing prior estimates and representing a significant industry investment. This level of expenditure emphasizes their focus on expanding AI infrastructure but also prompts analysis of potential impacts on future revenue growth and industry sustainability.
Microsoft announced a full-year 2026 capex guidance of around $190 billion, with a focus on GPUs and CPUs to meet AI demand. Amazon reported a Q1 capex of $44.2 billion, reaffirming its $200 billion guidance, with a notable shift toward in-house silicon like Trainium and Graviton, reducing dependency on NVIDIA. Alphabet’s Q1 capex reached $35.67 billion, more than doubling year-over-year, driven by its TPU silicon and Google Cloud backlog exceeding $460 billion. Meta’s capex is estimated between $125-145 billion, with a 35-50% increase and recent debt issuance to fund infrastructure growth. Collectively, these companies are outspending their free cash flow and raising debt, indicating a strategic commitment to AI infrastructure development that may extend beyond immediate financial returns.
$725 billion. The question capex doesn’t answer.
April 29, 2026. Largest capital-expenditure cycle in modern tech history. Lock-in across the Big Four.
Microsoft $190B. Amazon $200B. Alphabet $185B. Meta $125-145B. Up from $670B high-end consensus going in. +69% YoY surge over 2025. NVIDIA fell on the news. The structural questions — depreciation, power, in-house silicon, demand-pull, geopolitical — resolve through 2027-2028.
Four hyperscalers. $725B committed.
Each hyperscaler beat-and-raised in the same 24-hour window April 29. Microsoft / Amazon / Alphabet / Meta. The capex commitment is non-discretionary at this scale — companies cannot back out without creating asset write-downs and capacity gaps.
Three paths. One question.
The capex buildout resolves through one of three structural paths. The honest assessment: the demand signals are real, the supply signals are real, and the balance between them is the structural question.
- Demand +60-100% YoYEnterprise translates fully.
- Utilization 85%+NVIDIA pricing power holds.
- $2.8T by 2028Jensen trajectory matches.
- No impairmentCapex fully accretive.
- Outcome: Multiples expand. Foundation for next decade.
- Demand +30-60% YoYPartial translation.
- Utilization 75-85%Weaker pockets visible.
- NVDA decel 75% → 30-50%Manageable adjustment.
- $30-80B impairmentLimited 2028 cycles.
- Outcome: Multiples compress modestly. No crisis.
- Demand +15-30% YoYEnterprise falls short.
- Utilization 65-75%Capacity glut visible.
- $150-300B impairmentBig Four 2027-2028.
- NVDA sharp decelPricing compression.
- Outcome: 30-50% multiple compression. Post-2001 telecom analog.
Five vectors. Interdependent.
Capital-allocation risks of this magnitude resolve through specific structural channels. The vectors are not independent — power constraints delay deployment which compresses utilization which triggers impairment.
Capital intensity has reset upward as the new baseline for tech-platform leadership. The competitive moat is partly capital availability rather than purely product or technology innovation. Tech-platform leadership now requires capital-deployment scale that fewer companies can execute.
Four assignments. By role.
Reset on structural pricing-power compression.
Bull case requires NVIDIA to maintain addressable share through FY27-FY28; in-house silicon migration argues that share compresses. Position accordingly. Consider AMD, Broadcom, downstream networking suppliers as partial substitutes that may benefit from compression. Stop pricing the $2.8T-by-2028 ceiling literally.
Treat capex as tailwind and risk factor.
Microsoft best-positioned through capacity-constrained Azure demand. Alphabet best-positioned through TPU silicon independence. Amazon best-positioned through Trainium/Inferentia revenue diversification. Meta most exposed through internal-product-only revenue offset. Position differentially rather than treating Big Four as equivalent.
Use the buildout to negotiate.
Capacity becoming abundant; pricing under structural pressure. 2-3 year contracts with capacity guarantees + price-discount escalators that capture unit-cost reduction as buildout absorbs. Multi-cloud sourcing more attractive as capacity scarcity ends. The negotiating window opens through 2026-2027.
Plan for capacity glut by H2 2027.
Capex commitment produces more compute than current demand absorbs at current pricing. API pricing pressure compounds through 2027-2028. China sphere cost gap (5-30× cheaper) makes more acute. Margin guidance for next 18 months should explicitly model capacity-driven price compression. Hedge accordingly in S-1 disclosures.
Implications of Record-Breaking AI Infrastructure Spending
This level of investment indicates a strategic emphasis on AI infrastructure expansion within the tech industry. The increased debt and expenditure relative to free cash flow suggest a focus on long-term growth strategies. Market responses, such as NVIDIA’s stock performance despite record data center revenues, reflect ongoing questions about the efficiency and potential returns of this level of capital expenditure. The sustainability of this approach will depend on future revenue generation and industry developments, with potential risks if anticipated growth does not materialize.
AI Hardware Engineering: Designing GPUs, TPUs, and Neural Processing Units for High-Throughput Machine Learning Workloads (AI Infrastructure, Hardware & Compiler Engineering Series)
As an affiliate, we earn on qualifying purchases.
As an affiliate, we earn on qualifying purchases.
Historical and Strategic Context of AI Capex Surge
Over recent years, hyperscalers have increased their investments in AI infrastructure, with the first quarter of 2026 marking a notable peak. The combined capex of the Big Four now accounts for a significant portion of their revenue, reflecting a strategic shift toward building the necessary infrastructure for AI capabilities. Companies like Google have leveraged custom silicon, such as TPUs, for over a decade. The current cycle is driven by rising AI workloads and API revenue, but also faces challenges from pricing pressures and potential overcapacity. Industry debates have previously centered on compute concentration among major cloud providers and the efficiency of AI compute, issues now intensified by the scale of 2026’s spending.
“Our guidance remains at $200 billion for 2026, with a strategic focus on developing in-house silicon to reduce reliance on external GPU providers.”
— Amazon CEO Andy Jassy

ARCTIC Freezer 4U-M (Rev. 2)
- Altera Compatibility: Requires separate Ampere Kit or version
- Compact Design: Fits in 4U server cases, saves space
- Dual-CPU Compatible: Does not block RAM slots
As an affiliate, we earn on qualifying purchases.
As an affiliate, we earn on qualifying purchases.
Market Skepticism and Structural Risks
It remains uncertain whether the current levels of hyperscaler capital expenditure will result in proportional revenue and earnings growth. Market reactions, such as NVIDIA’s stock decline despite record data center revenues, indicate ongoing questions about the efficiency of the investments and the risk of overcapacity. The long-term implications of in-house silicon development and pricing pressures are also uncertain, as is the potential for impairment cycles if expected revenue growth does not materialize.
Empire of AI: Dreams and Nightmares in Sam Altman's OpenAI
As an affiliate, we earn on qualifying purchases.
As an affiliate, we earn on qualifying purchases.
Monitoring Revenue Growth and Infrastructure Efficiency
Investors and industry analysts will closely observe upcoming quarterly earnings reports for signs of revenue growth attributable to infrastructure investments. Key areas of focus include the sustainability of capex levels without compromising profitability, developments in in-house silicon strategies, and the effects of pricing pressures. Regulatory considerations and debt management will also influence future spending plans, making the next 12-18 months critical for assessing the outcomes of this significant capex cycle.
Dynamic Resource Allocation in Embedded, High-Performance and Cloud Computing
As an affiliate, we earn on qualifying purchases.
As an affiliate, we earn on qualifying purchases.
Key Questions
Why is the 2026 hyperscaler capex so significant?
This represents a substantial investment in AI infrastructure, reflecting a strategic shift toward building the foundational hardware necessary for AI capabilities, with potential implications for industry competition and economics.
Will this massive spending translate into revenue growth?
The outcome remains uncertain. While increased AI workloads and backlog are reported, market skepticism persists regarding whether the infrastructure investment will generate proportional earnings, especially amid pricing pressures and potential overcapacity.
How might in-house silicon development affect NVIDIA?
The development of in-house silicon, such as Google’s TPUs and Amazon’s Trainium, could reduce reliance on NVIDIA, potentially influencing its market share and pricing power over time.
What risks does the hyperscaler spending pose to financial stability?
Spending levels that exceed free cash flow and increased debt issuance could pose financial risks if revenue growth does not meet expectations, potentially leading to impairment cycles or other financial challenges.
Source: ThorstenMeyerAI.com