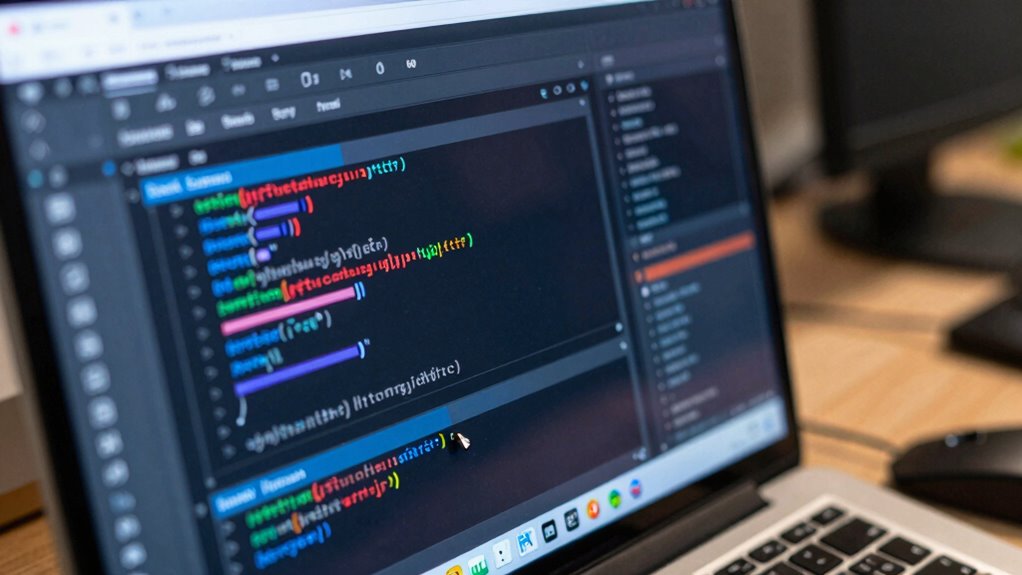

As a beginner, you’ll find Browser DevTools invaluable for inspecting elements, debugging code, and improving websites. You can easily view and adjust styles in real-time, helping you understand layouts and design choices. Setting breakpoints and using the console helps identify issues quickly. The tools also let you test responsiveness and monitor network activity—all without changing your source files. Keep exploring, and you’ll gain more confidence and skills in building and troubleshooting websites.

Get business pricing on monitors, keyboards and dev gear
- Business-only prices and quantity discounts
- Tax-exempt purchasing
- Multiple users, one account, clear invoices
Key Takeaways
- Use DevTools to inspect website elements and understand their structure and styles in real-time.
- Set breakpoints to pause JavaScript execution and identify issues step-by-step.
- Edit CSS and HTML live to test design changes instantly without modifying source files.
- Monitor network activity to analyze resource load times and optimize performance.
- Utilize device emulation and testing tools to ensure responsiveness across different screens.
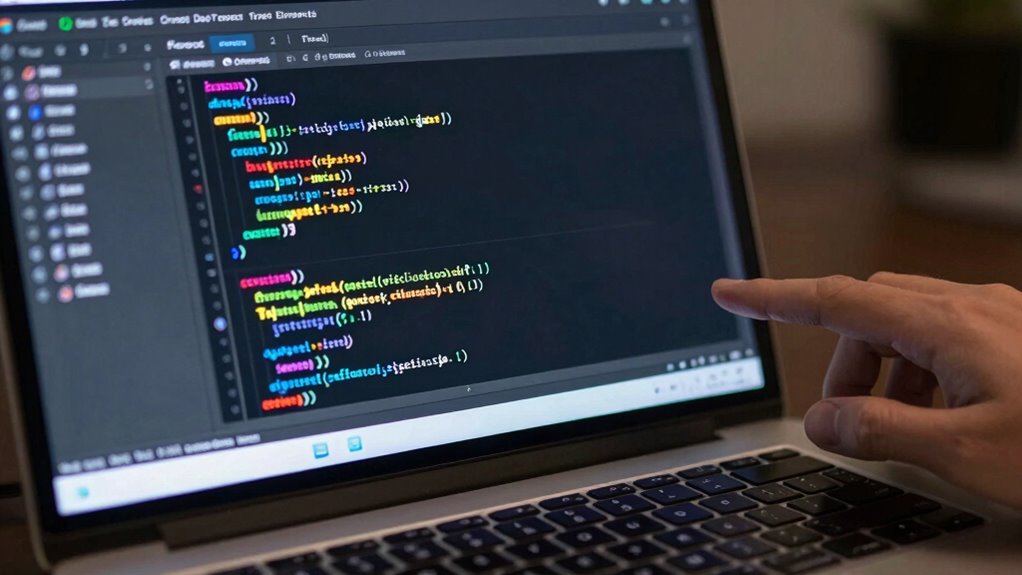
If you’re new to web development or just want to understand how websites work behind the scenes, browser DevTools are an essential tool to learn. They’re the window into your website’s code, allowing you to inspect elements, troubleshoot issues, and optimize performance. When you open DevTools, you get access to multiple panels that reveal the structure, styles, and scripts running on your page. This visibility helps you understand the digital concepts that underpin modern websites, making your development process more informed. This understanding is especially important when working with complex layouts or interactive features. This helps you see exactly how your layout is built, especially when working with complex CSS grid layouts. You can see how grid lines are defined, how items are placed, and make instant adjustments to the CSS, which saves a lot of trial and error. Exploring the CSS grid panel gives you a visual understanding of how your grid is organized, making it easier to design responsive and flexible layouts. Moreover, understanding contrast ratios and how they influence visual clarity can be beneficial when optimizing your site’s accessibility and readability. Recognizing how these ratios are calculated and applied can help ensure your site is accessible to all users. One of the most valuable features of DevTools is JavaScript debugging. When your site isn’t behaving as expected, you can set breakpoints in your scripts to pause execution at critical points. This allows you to step through your code line by line, examine variable values, and understand exactly where things go wrong. Instead of guessing why a button doesn’t work or why a dynamic element isn’t updating, you can pinpoint the problem efficiently. The console panel is also a powerful tool, giving you immediate feedback by running JavaScript commands or checking for errors. Whether you’re testing snippets or inspecting logs, it’s an invaluable resource for troubleshooting. Additionally, mastering browser inspection techniques can help you identify issues faster and improve your overall debugging skills. Using DevTools regularly helps you become more confident in your coding skills. You can tweak styles on the fly, see how changes affect your layout instantly, and test different scenarios without altering your actual code files. This rapid cycle of inspection, editing, and testing makes developing websites more interactive and less frustrating. Additionally, you can monitor network activity to see how resources load, which is crucial when optimizing your site’s speed. As you grow more comfortable, you’ll learn to use features like device emulation to test responsiveness or performance tools to analyze your website’s efficiency. Recognizing the importance of proper eco-friendly disposal of outdated or damaged gear can also help reduce environmental impact while maintaining your workspace. Incorporating knowledge of testing methodologies can further improve your debugging accuracy and efficiency. In short, browser DevTools are your best friend in web development. They empower you to inspect your code visually, debug JavaScript issues precisely, and refine your designs with real-time feedback. Mastering these tools will not only speed up your workflow but also deepen your understanding of how websites are built and function behind the scenes. The more you explore, the more intuitive your development process becomes.
As an affiliate, we earn on qualifying purchases.
Frequently Asked Questions
How Can I Customize My Devtools Workspace?
You can customize your DevTools workspace by adjusting workspace organization and theme customization. To do this, open DevTools, click the gear icon for settings, and explore options like panels, docking, and layout preferences for better workspace organization. For theme customization, choose between light or dark themes under the appearance settings. These tweaks help you create a more comfortable, personalized environment, making debugging more efficient and enjoyable.
Are There Keyboard Shortcuts for Faster Inspection?
Think of your keyboard as a magic wand in your toolkit. Yes, there are shortcuts for faster inspection—like pressing F12 or Cmd+Option+I, which act as keys to reveal insights swiftly. You can also customize shortcuts to fit your flow, boosting keyboard efficiency. By tailoring these keys, you turn your inspection process into a smooth dance, making debugging feel more natural and less like searching for the right spell.
How Do I Troubleshoot Mobile View Issues?
To troubleshoot mobile view issues, start by enabling the device toolbar in DevTools to simulate different screen sizes and test responsive design. Use touch event debugging tools to identify how your site responds to touch interactions. Check for layout problems, broken elements, or inconsistent styles. Adjust CSS as needed and keep testing across various devices to guarantee a seamless mobile experience. This process helps you efficiently resolve mobile-specific bugs.
Can I Automate Devtools Tasks?
Yes, you absolutely can automate DevTools tasks! Imagine turning your endless, repetitive debugging sessions into a smooth, automated process—it’s like having a superhero sidekick. With tools like automated testing and script integration, you can write scripts to run tests, inspect elements, or even fix bugs automatically. This saves you hours, boosts consistency, and lets you focus on the fun stuff—creative problem-solving instead of manual drudgery.
What Are the Best Extensions for Devtools?
You should try extensions like “CSS Grid Overlay” to visualize grid layouts and “Axe DevTools” for accessibility audits. These tools enhance your DevTools experience by making CSS Grid inspection straightforward and ensuring your site meets accessibility standards. Installing these extensions helps you quickly identify layout issues and accessibility problems, streamlining your workflow. They’re essential for developing responsive, user-friendly websites efficiently.
browser developer tools for beginners
As an affiliate, we earn on qualifying purchases.
As an affiliate, we earn on qualifying purchases.
Conclusion
As a beginner, mastering browser DevTools can feel overwhelming, but remember, over 80% of web developers rely on these tools daily to troubleshoot and refine websites. With practice, you’ll quickly uncover how powerful and intuitive they are, transforming complex issues into manageable tasks. Keep exploring, experimenting, and debugging—soon, you’ll confidently inspect, debug, and optimize like a pro. The more you use DevTools, the more your skills will grow, making your web development journey truly rewarding.
As an affiliate, we earn on qualifying purchases.
As an affiliate, we earn on qualifying purchases.
Fall Picks
fall essentials
As an affiliate, we earn on qualifying purchases.